This tutorial allows to: Enable CMCD Reporting for 5G Media Streaming.
What you will build: a 5GMSd deployment where the Application Server extracts CMCD from media requests and forwards it to the cmcd-toolkit collector, which you view on a Grafana dashboard.
CMCD Reporting enables the collection of CMCD(Common Media Client Data, CTA-5004) from the media player and the forwarding of CMCD metrics through the 5G Media Streaming system for monitoring and analysis.
CMCD information is reported in-band with media requests using HTTP query parameters or request headers, and is extracted by the Application Server during normal media delivery. The Application Server then forwards the collected and formatted CMCD metrics to a CMCD Collector, where they can be visualized via a dashboard for analyzing media session behavior and content delivery characteristics.
This tutorial describes how to set up and enable CMCD Reporting in the Reference Tools, and how to access the CMCD dashboard.
Prerequisites
A working AF and AS from the basic end-to-end guide: Steps 1 to 6 below point back to that guide, so if you already have a running end-to-end deployment you can move quickly through them. Docker is used to run the cmcd-toolkit collector, database and dashboard.
Note on ports: the components below listen on different ports, which is intentional. The collector ingests CMCD on port 3000 (the cmcd_collector_url points here); the Grafana dashboard UI is served on port 8081. The 5GMS Application Server itself is reached on its normal HTTP port.
Note on CMCD versions: the collector converts incoming CMCD version 1 (v1) reports to version 2 (v2), as shown in the collector logs later in this tutorial.
Server-side setup
Step 1: Install the Application Function
For details please refer to the corresponding section in the basic end-to-end guide.
Step 2: Basic Configuration of the Application Function
Follow the basic configuration steps documented in the basic end-to-end guide.
Step 3: Start the Application Function
Follow the command documented in the basic end-to-end guide.
Step 4: Install the Application Server
For details please refer to the corresponding section in the basic end-to-end guide.
Step 5: Enable/Disable CMCD in the Application Server
Configure the URL of the CMCD Collector in src/rt_5gms_as/context.py:
-
To enable CMCD on the AS, set
cmcd_collector_urlto the collector endpoint, replacing<CMCD_DASHBOARD_IP>with the IP of the machine running the CMCD dashboard (note the ingest port3000):cmcd_collector_url = http://<CMCD_DASHBOARD_IP>:3000/cmcd/response-modeFor example:
http://10.64.39.13:3000/cmcd/response-mode. -
To disable CMCD on the AS, leave
cmcd_collector_urlempty (the default). An empty value means CMCD forwarding is disabled.
Step 6: Start the Application Server
For details please refer to the corresponding section in the basic end-to-end guide.
Step 7: Deploy the cmcd-toolkit
cmcd-toolkitCMCD collector, database and Grafana dashboard, run via Docker Compose.Step 7.1 Clone cmcd-toolkit
git clone https://github.com/5G-MAG/cmcd-toolkit.git
Step 7.2 Compose
chmod 777 cmcd-toolkit/grafana/local-stack/dashboards/cmcd-dashboard.json
docker compose up
Step 7.3 Login to Grafana at http://<DASHBOARD_IP>:8081
- User: admin
- Password: grafana
Step 8: Verify the dashboard with fake CMCD message
Run the command below (replace <YOUR_MACHINE_IP_HERE> with the IP of the machine that the 5GMS Application Server is running on). If it works, you should see that a new CMCD report has been received in the dashboard.
ts=$(date +%s%3N)
curl -i "http://<YOUR_MACHINE_IP_HERE>/media/test.m4s?CMCD=\
cid=\"_30fps/bbb2_30fps.mpd\",\
sid=\"demo\",\
su,\
br=1500,\
d=4000,\
bl=3500,\
tb=8000,\
dl=0,\
mtp=18000,\
nor=\"bbb2_30fps_2.m4s\",\
nrr=\"0-2000\",\
pr=1.0,\
sf=d,\
st=v,\
ot=i,\
ts=${ts},\
v=1"
Client-side setup
With the server-side set up, focus shifts to the client side.
Step 1: Installation, Configuration and Running the 5GMSd Client
Please follow the instructions documented in the basic end-to-end guide setup guide.
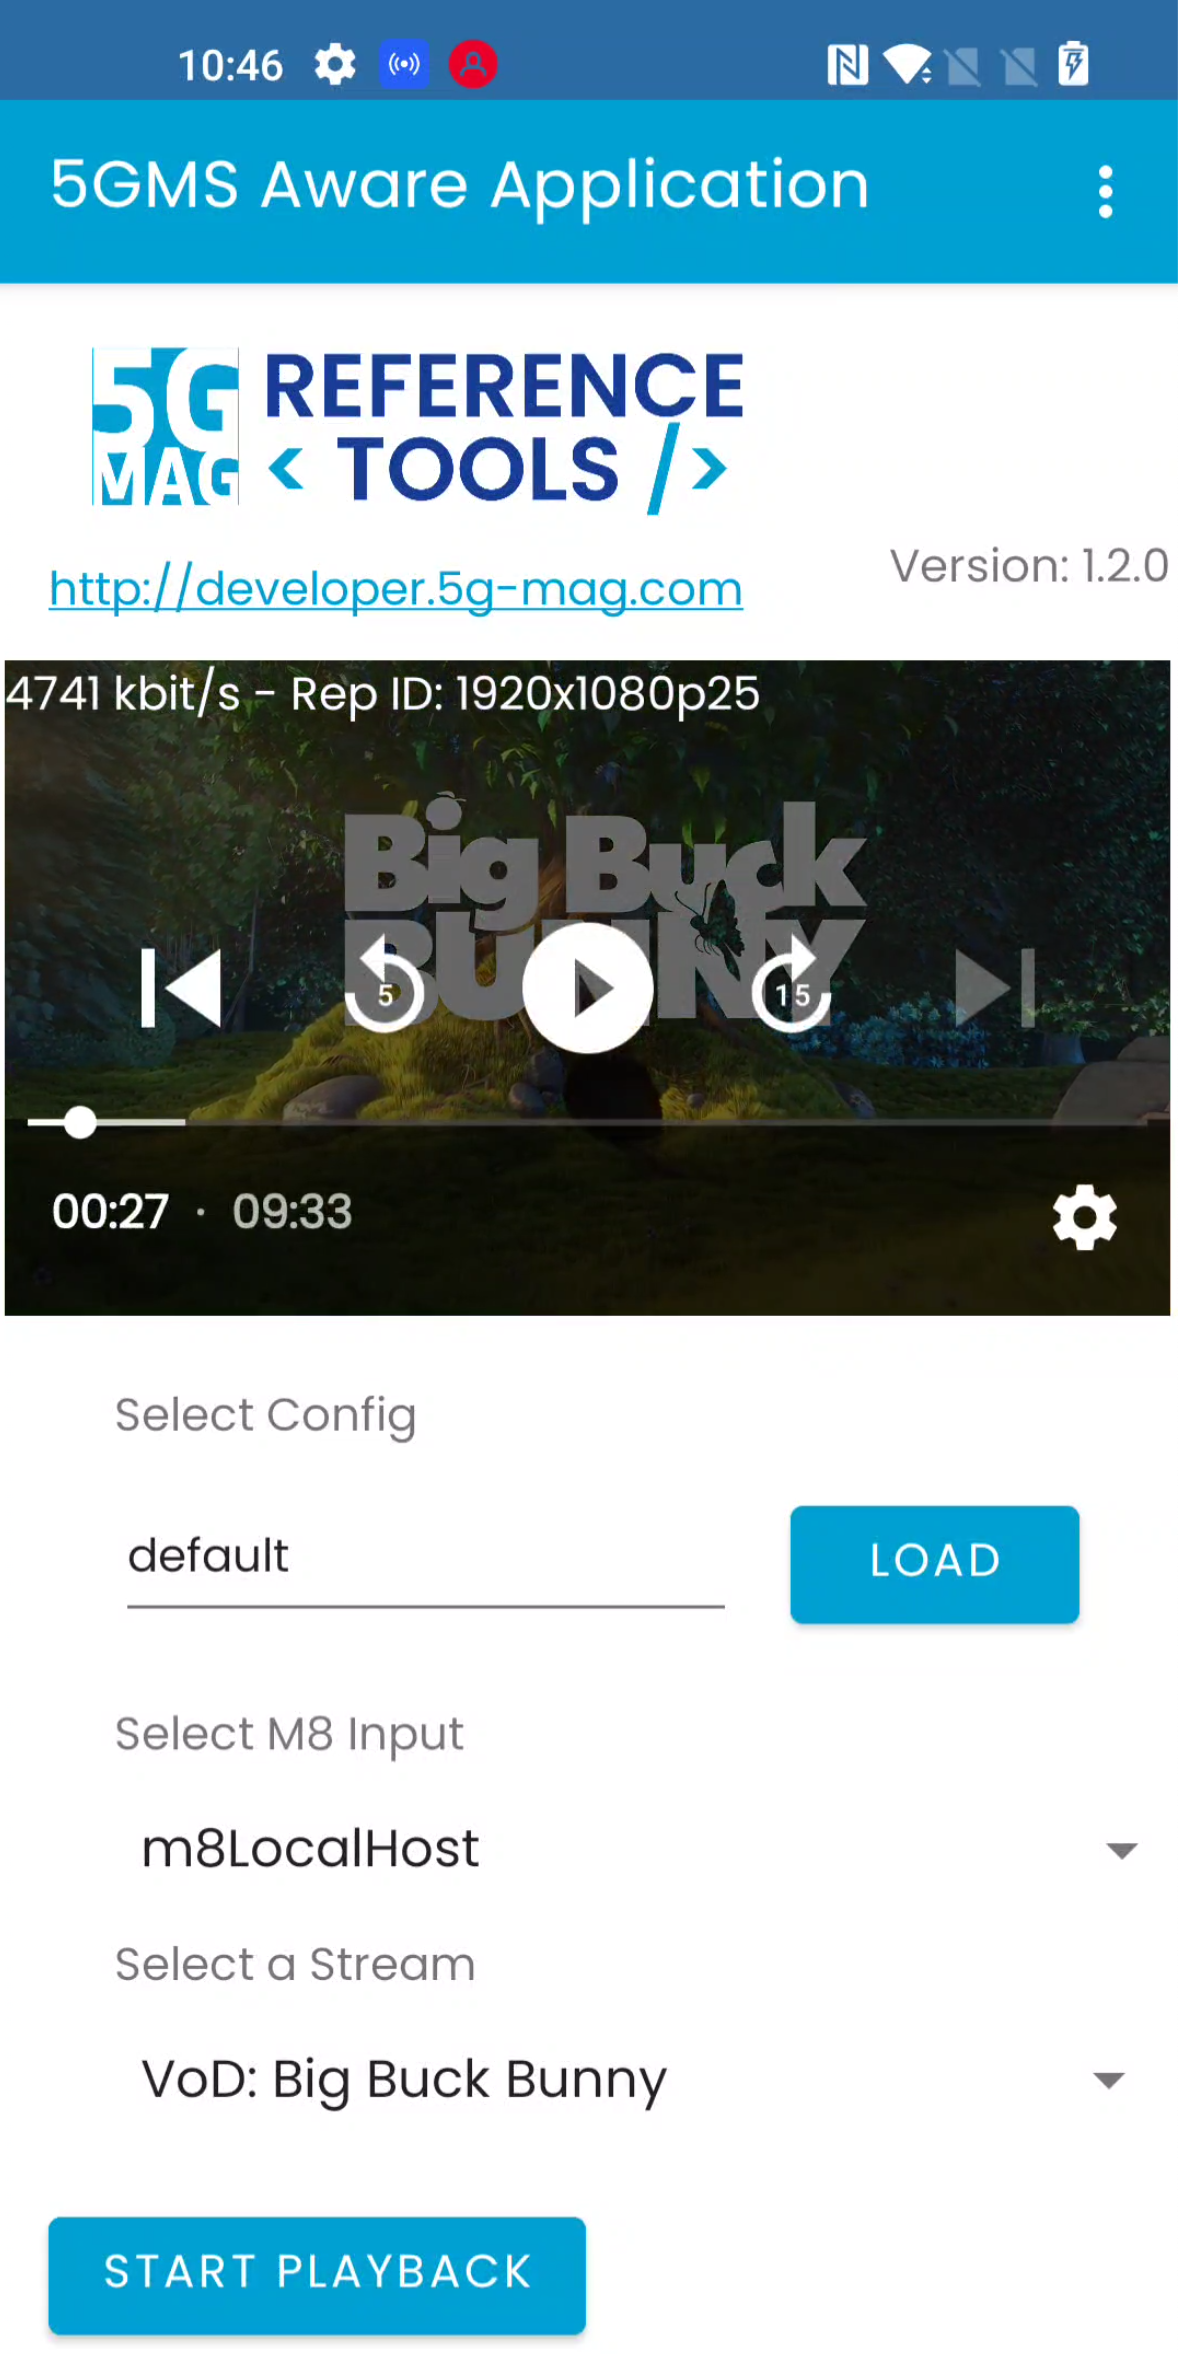
Step 2: Creating CMCD Report
While consuming content via the previously installed 5GMSd Application Server and 5GMSd Application Function, the client automatically collects and sends CMCD Reports.
Step 3: Inspecting the CMCD Report in Dashboard
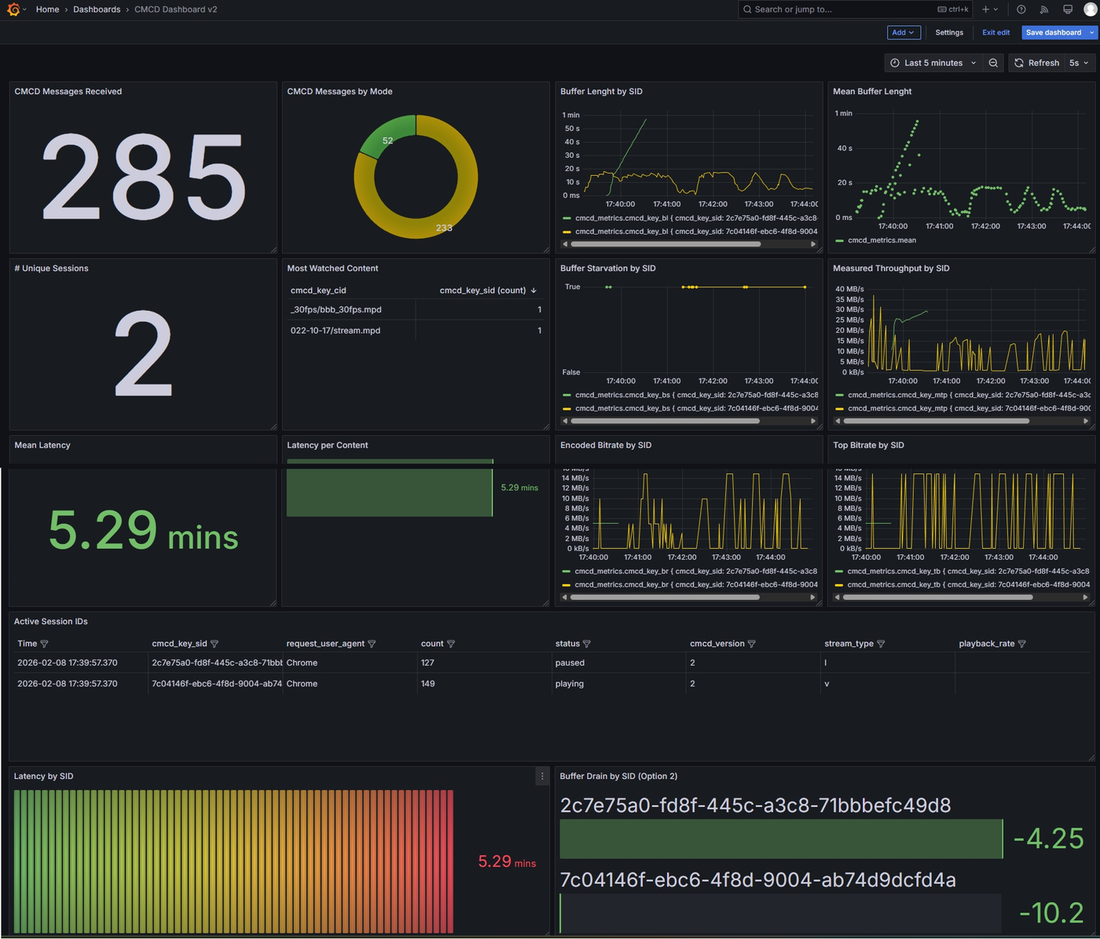
Navigate to http://<CMCD_DASHBOARD_IP>:8081/dashboards in your browser (note the Grafana UI port 8081), like below you should see:
Logs for Debugging
Nginx access (watch the CMCD message the AS received):
    docker exec -it <AS container ID> bash # enter the container
    ps -ef | grep nginx # Find log path
    tail -n 0 -f <Your access log path>
Nginx error :
    docker exec -it <AS container ID> bash # enter the container
    ps -ef | grep nginx # Find log path
    tail -n 0 -f <Your error log path>
CMCD Collector(watch the conversion result from CMCD v1 to v2):
docker logs -f --tail 10 cmcd-toolkit-collector-1
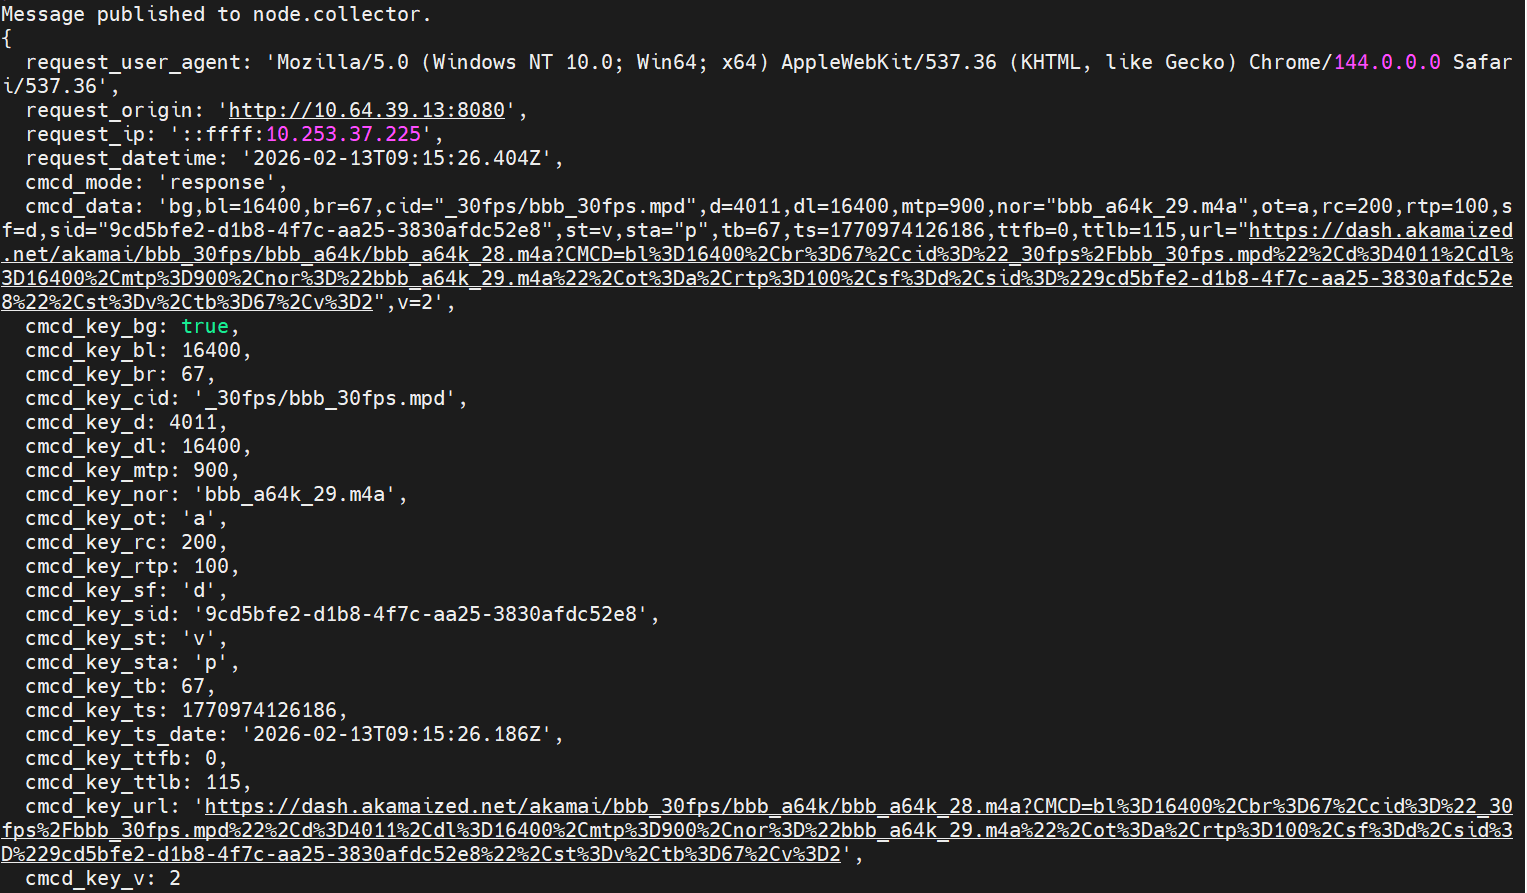
Fluentd(watch the log of the dashboard database)
docker logs cmcd-toolkit-fluentd-1 | grep -i "node.collector"
Grafana(watch the log of the dashboard)
docker compose logs grafana | egrep -i "provision|dashboard|yaml|error|warn" | tail -n 200
Database for Debugging
This section is optional and illustrative. It shows how to query the InfluxDB database directly if you want to inspect the stored CMCD metrics behind the dashboard; it is not required for normal use.
user@host:~$ docker exec -it cmcd-toolkit-influxdb-1 influx
--------------
USE analytics;
SHOW MEASUREMENTS;
---------
SHOW FIELD KEYS FROM "cmcd_metrics";
SHOW TAG KEYS   FROM "cmcd_metrics"


SHOW TAG VALUES FROM "cmcd_metrics" WITH KEY = "cmcd_key_sid"
WHERE time > now() - 30m;

SELECT * FROM "cmcd_metrics" WHERE "cmcd_key_sid"='3f63f118-a5c5-44ba-a155-9522904b44cb' ORDER BY time DESC LIMIT 5;
SELECT * FROM "cmcd_metrics" WHERE "cmcd_key_sid"='demo' ORDER BY time DESC LIMIT 5;
SELECT COUNT(*) FROM "cmcd_metrics" WHERE "cmcd_key_sid"='demo';

user@host:~$ docker exec -it cmcd-toolkit-influxdb-1 influx
Connected to http://localhost:8086 version 1.8.10
InfluxDB shell version: 1.8.10
> USE analytics;
Using database analytics
> SHOW MEASUREMENTS;
name: measurements
name
----
cmcd_metrics
> SHOW FIELD KEYS FROM "cmcd_metrics";
name: cmcd_metrics
fieldKey         fieldType
--------         ---------
cmcd_data        string
cmcd_key_bg      boolean
cmcd_key_bl      integer
cmcd_key_br      integer
cmcd_key_bs      boolean
cmcd_key_d       integer
cmcd_key_dl      integer
cmcd_key_e       string
cmcd_key_ltc     integer
cmcd_key_msd     integer
cmcd_key_mtp     integer
cmcd_key_nor     string
cmcd_key_ot      string
cmcd_key_pr      float
cmcd_key_rc      integer
cmcd_key_rtp     integer
cmcd_key_sf      string
cmcd_key_st      string
cmcd_key_sta     string
cmcd_key_su      boolean
cmcd_key_tb      integer
cmcd_key_ts      integer
cmcd_key_ts_date string
cmcd_key_ttfb    integer
cmcd_key_ttlb    integer
cmcd_key_url     string
cmcd_key_v       integer
request_datetime string
request_origin   string
> SHOW TAG KEYS   FROM "cmcd_metrics"
name: cmcd_metrics
tagKey
------
cmcd_key_cid
cmcd_key_sid
cmcd_mode
request_ip
request_user_agent
Next steps
- Try the related reporting tutorials: Consumption Reporting and QoE Metrics Reporting.
- Return to the Tutorials index.